One such technique is outlined in the diagram below. The so-called Tight phase lock loop method relies on phase-locking the DUT and reference oscillators in a loop bandwidth that's substantially higher than the minimum period of interest in the measurement. Given reasonable linearity on the part of the tuned oscillator, the loop's error voltage will track any differences in frequency between the DUT and reference.
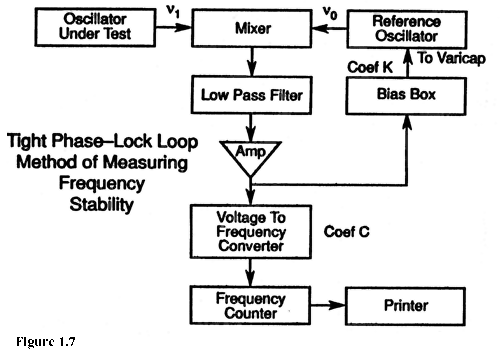
The tight-PLL method is capable of achieving high measurement precision with a low inherent noise floor, but it was initially described at a time when its
"display" consisted of a line printer duct-taped to a frequency counter. Warren Sarkinson recently brought the tight-PLL method up to date,
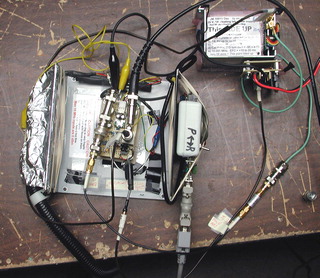
using a 12-bit, 480-Hz serial DAQ in place of the voltage-to-frequency converter in the diagram above. Following some positive initial results, Warren loaned his prototype to me for testing against
one of the better commercial timing analyzers available, the TSC-5120A from Symmetricom. This
instrument was generously made available for the evaluation process by Tom Van Baak of leapsecond.com and the time-nuts list.
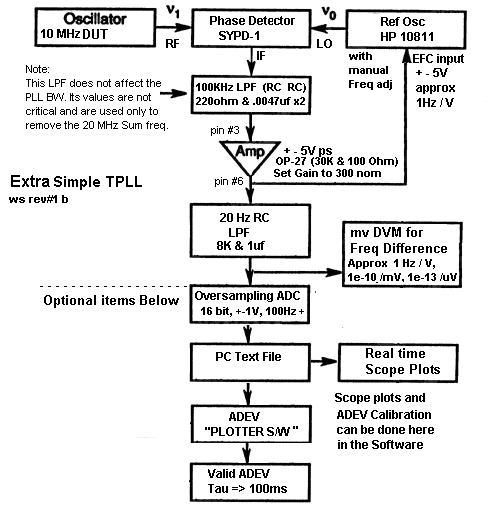
Warren's annotated block diagram can be seen here. The diagram's original source was chapter 8 of NIST's Statistics of Time and Frequency Data Analysis (6.8 MB .PDF), page 170. A much-larger file containing the entire monograph, Time and Frequency: Theory and Fundamentals, can be found here (81 MB .PDF).
_________________________________________________________
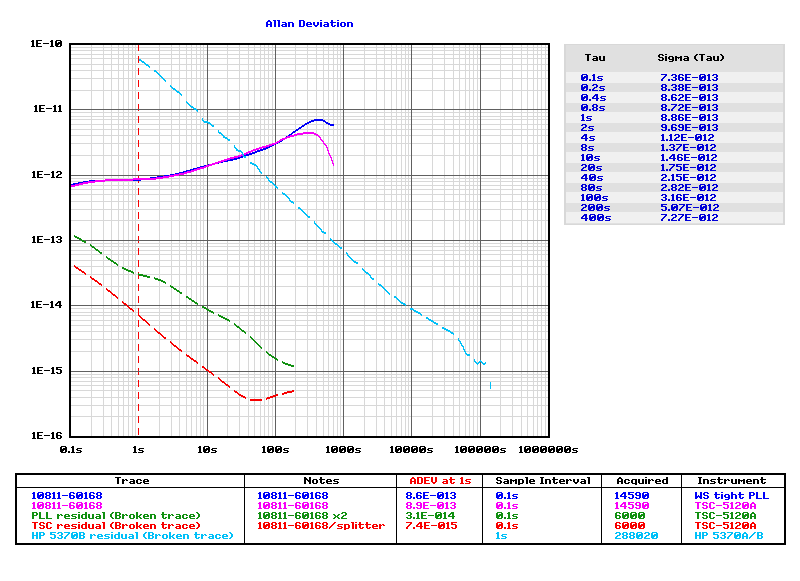
Two HP 10811-60168 OCXOs were used as the tight PLL's DUT and reference oscillators in these initial tests. These oscillators are capable of short-term Allan deviation performance in the high 1E-13 range. As noted above, one of the oscillators -- either the reference or DUT -- must be steered by the loop. Consequently it wasn't possible to conduct a true simultaneous measurement, where the tight PLL measures a given oscillator pair at the same time the TSC 5120A does. Instead, the magenta and blue traces above represent two separate runs, each about a half-hour long, one on each instrument.
It's natural to see substantial divergence in ADEV plots at longer timescales, both because uncertainty is high when fewer points are available for analysis and because the reference and DUT will never exhibit the same drift characteristics from one run to the next. The important observation in this case is that the two traces are very close to each other at timescales below 100 seconds. This degree of fidelity suggests that there are no gross problems with the software or hardware, and that no 'showstopper' weaknesses in Warren's overall implementation are likely to be present.
As an aside, what happens when we do attempt to measure the DUT and reference oscillators with the TSC 5120A while they're being steered together during a run? The resulting ADEV trace shows how well the PLL is keeping the two oscillators locked together. In principle, this trace should serve as an indication of the PLL's residual performance floor, which is limited by the noise introduced to the measurement by the mixer, opamp and associated components within the loop. Components outside the loop such as the DAQ adapter and the software itself do not participate in this residual measurement, and could potentially degrade the real-world performance floor beyond what's seen here.
That said, there's probably no reason why Warren's PLL couldn't be used for measurements in the low 1E-14/tau range, just as the NIST documentation suggests. It might be necessary to spend more than $25 on a better DAQ adapter, but there's not much more room for improvement as far as I'm aware. For all practical purposes, the performance of this method is limited by the performance of the reference OCXO.
The TSC 5120A's own residual floor, measured by feeding one of the 10811-60168 oscillators to both its input and
reference ports via a Mini-Circuits ZFSC-2-1 splitter, is shown in red. For comparison,
the cyan trace is typical of the measurement floor achievable with traditional time-interval counters
such as the HP 5370B, with overall jitter in the 20-60 ps neighborhood. There are a great many interesting devices
whose short-term stability can't be measured directly with a TIC!
_________________________________________________________
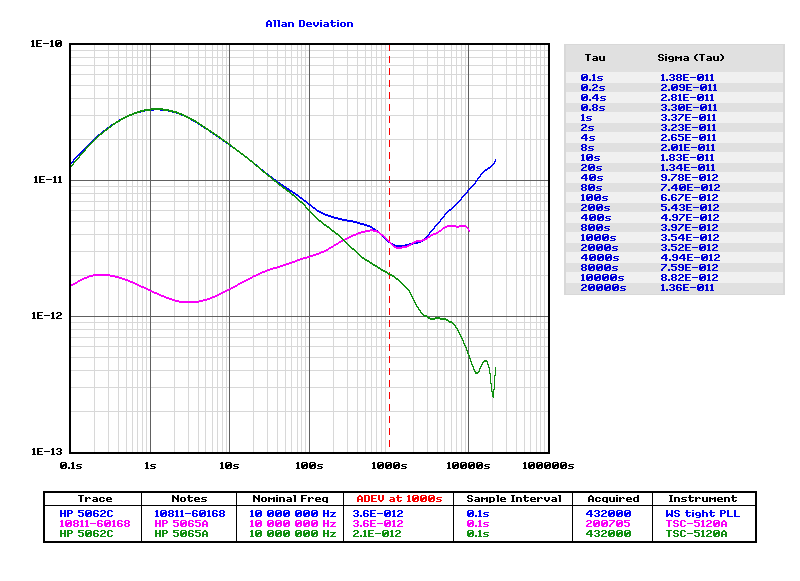
In the blue trace above, the DUT OCXO from the previous test was replaced with an HP 5062C cesium-beam frequency reference. The HP 5062C was a lightweight, ruggedized atomic clock intended for service in aircraft, submarines, and other harsh environments, so it's somewhat noisier than the better-known 5061A/B models... and the cesium-beam tube in mine has definitely seen better days. As a result, this particular 5062C makes a handy noise source. At timescales below t=100s its stability is substantially worse than a free-running 10811-class OCXO, so it's easy for the tight PLL to measure. Further, the 5062C exhibits almost all of the noise slopes commonly encountered in stability-analysis work, making it a good test subject.
Once again, overall conformance between the tight PLL tester and the TSC 5120A is excellent, to the extent such a judgement call can be made on the basis of two separate 12-hour runs. After the tight PLL run, the TSC 5120A was used to measure the PLL's reference OCXO against a much more stable HP 5065A rubidium standard. This yielded excellent agreemeent between the magenta and blue traces in the t=700s-1200s range. Beyond t=1200s, the usual combination of reference drift and ADEV precision limited the measurement's reproducibility.
The dark green trace was taken concurrently with the tight PLL run, using the TSC 5120A to observe the HP 5062C's performance against the same 5065A that was later used to evaluate the reference OCXO.
One observation from this test is that there don't seem to be any major precision-loss issues associated with the
frequency averaging or frequency-to-phase conversion code, even in records approaching a half-million points. It appears reasonable
to use the tight PLL method in measurements lasting several hours.
_________________________________________________________
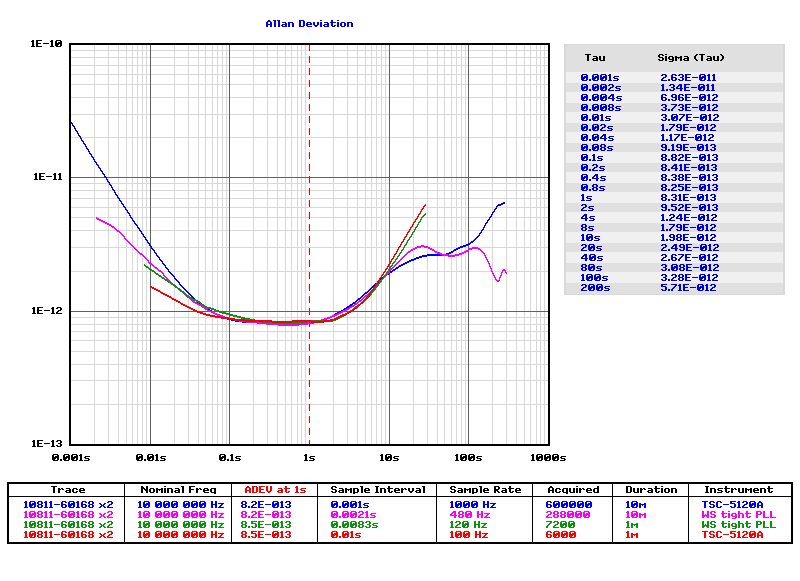
Above, some short runs were taken at different measurement bandwidths, determined by the size of the averaging kernel applied by TI.EXE to the incoming data.
The data corresponding to the blue and magenta traces was left unprocessed, rendered at the maximum acquisition rates of 1000 samples per second and 480 samples per second for the TSC 5120A and tight PLL, respectively.
Next, PLL and TSC runs were taken with decimation by 4:1 and 10:1, shown in the green and red traces. Filtering was performed by simply averaging each batch of four or ten incoming data points together. (Optimum trace fidelity was obtained in the PLL's case by averaging the data after conversion to phase-difference values, rather than operating on the DAQ readings directly.)
There are no real surprises here -- lower measurement bandwidths yield lower sigma(tau) readings in the region dominated by the 10811's flicker phase and white phase noise slopes. The TSC 5120A's slope below 0.01s is probably limited by its own residual noise.
Conversely, the tight PLL has a 150 Hz low-pass RC filter prior to the 480 Hz DAQ, so its
120 Hz trace is only slightly "quieter" than its 480 Hz trace.
_________________________________________________________
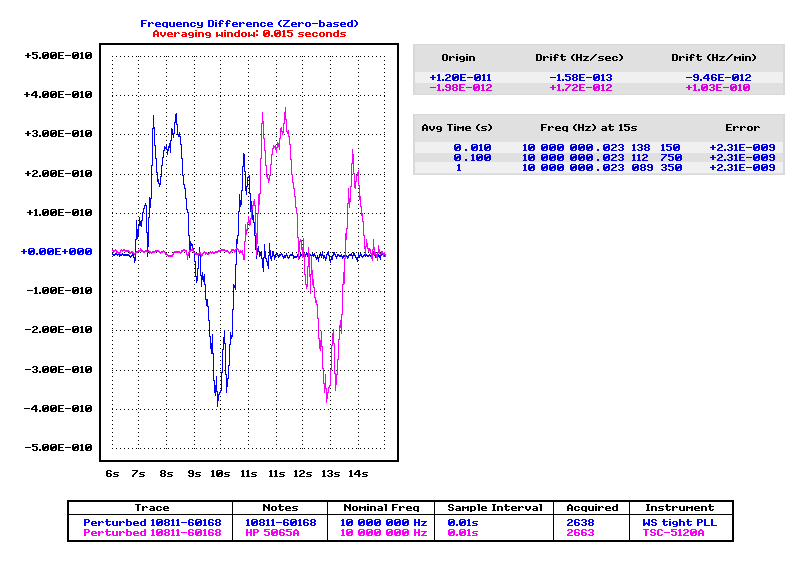
In this plot, the 10811-60168 DUT was picked up and tossed around on the workbench while being observed concurrently by the PLL (with its reference 10811-60168) and TSC 5120A (with the HP 5065A.) This mechanical abuse caused a peak-to-peak excursion of about 0.007 Hz, which corresponded to an EFC voltage transient at the reference OCXO of about 10 millivolts.
As this transient was weak enough to remain within a small segment of the reference oscillator's tuning curve, there's good agreement between the frequency-difference plots from the two instruments. (Note that data from the TSC 5120A is typically delayed by several seconds.)
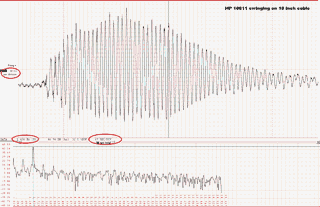
A similar test conducted by Warren involved swinging the 10811 in a pendulum-like fashion and recording the resulting EFC variation throughout several cycles (see image above).
_________________________________________________________
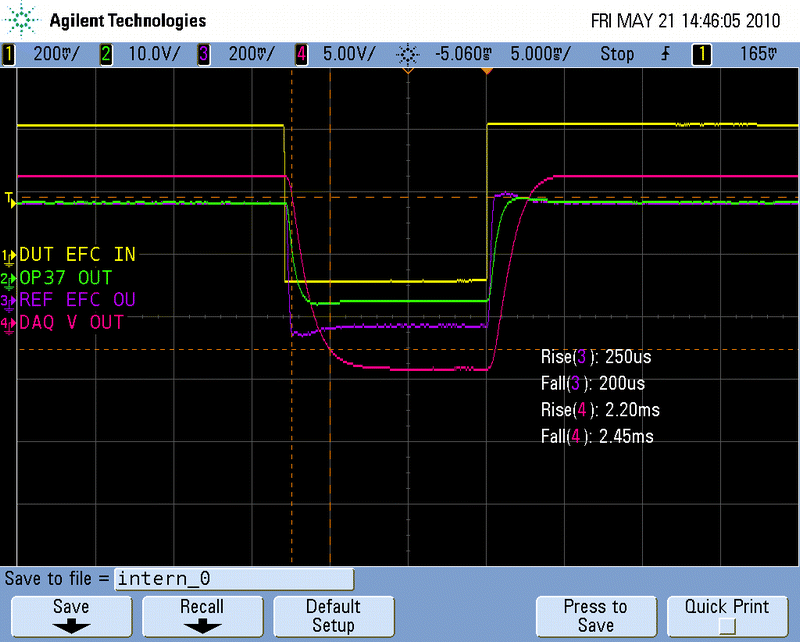
An estimate of loop bandwidth based on average edge times would be 0.35/225 us = 1.5 kHz as observed at
REF EFC OUT. However, as noted earlier, the error voltage as seen at DAQ V OUT is band-limited
to about 0.35/2.3 ms = 150 Hz.
_________________________________________________________
